

The Data Quality (DQ) App by Zimetrics, designed specifically for Snowflake, enhances the reliability, accuracy, and governance of your Snowflake data. By automating data quality checks and offering customizable test cases, the app ensures your data aligns with business needs and industry standards. With an intuitive interface that caters to both technical and non-technical users, the DQ app empowers teams to manage data quality and compliance proactively.
Key features include a Table Schema Viewer for inspecting table structures, Column Profiling to assess data at a granular level, and a real-time Dashboard that visualizes data quality metrics. These tools provide a seamless experience for monitoring and improving data quality across your Snowflake environment.
Need of data quality app
Ensuring data accuracy, consistency, and reliability is critical for any organization. Data quality issues, such as missing values, duplicates, and inconsistencies, can lead to flawed insights and poor decision-making. By automating validation, profiling, and monitoring, a DQ app ensures that data is fit for analysis and reporting. This improves trust in your data and leads to better business outcomes.
Business Needs
Our DQ app addresses core business needs by ensuring data accuracy, compliance, and governance while promoting operational efficiency. The automation of data quality checks reduces the need for manual validation, saving time and effort while ensuring that Snowflake data meets high standards of consistency and reliability.
With features like customizable data quality rules, the DQ app helps organizations enforce compliance and governance practices. Data stewards can define, monitor, and manage data quality rules tailored to specific business needs, all through an intuitive interface. This results in high-quality data that drives more informed and effective decision-making.
Features of DQ App
The Data Quality Application developed by Zimetrics offers comprehensive features designed to ensure the integrity and accuracy of your data. Our app provides the following key functionalities:
Feature Overview
- Table Schema viewer
The Table Schema Viewer allows users to easily inspect the schema of any selected table or view within Snowflake. This feature provides an organized view of the table structure, enabling quick validation of the schema.
- Column Profiling
Column Profiling offers detailed insights into the data at a granular level, displayed in a clear tabular format. This feature helps users assess data quality and includes the following metrics for each column:
- Column Name: The name of the column.
- Total Values: The total number of entries in the column.
- Data Completeness %: The percentage of non-null values in the column.
- Null %: The percentage of null values.
- Distinct %: The percentage of distinct values.
- Unique %: The percentage of unique values.
- Zero %: The percentage of zero values.
Configurable Test Cases
Users can create and configure test cases to assess data quality based on specific business requirements. These test cases can be manually re-run when new data is ingested into the table, ensuring continuous monitoring of data quality.
Types of Test Cases
Table Test Cases
These test cases validate key attributes of the table at a high level:
- Table Column Count To Be Between: Verifies whether the column count of the table falls within a specified range.
- Table Column Count To Equal: Ensures the column count of the table matches the expected number.
- Table Row Count To Be Between: Checks if the row count of the table falls within a specified range.
- Table Row Count To Equal: Validates whether the row count matches the expected number.
- Table Column Name Exists: Confirms that a specific column is present in the table.
Column Test Cases
These test cases focus on validating the data within individual columns:
- Column Value Max To Be Between: Ensures the maximum value of a column falls within a specified range.
- Column Value Min To Be Between: Verifies that the minimum value of a column is within the expected range.
- Column Value Mean To Be Between: Checks if the mean value of a column falls within the specified range.
- Column Value Median To Be Between: Validates that the median value of a column is within the expected range.
- Column Value Starts With: Ensures all values in a column start with a specific prefix, with the option to include null values.
- Column Value In Set: Verifies that all values in a column belong to a predefined set of values, with optional null value inclusion.
- Date Column Value Greater Than: Ensures all date-type column values are greater than a specified date.
- Column Null Validator: Validates that no null values exist in the column.
- Empty Value Validator: Ensures that the column contains no empty values.
- Unique Value Validator: Verifies that all values in the column are unique.
- Dependent Column Data Validator: Checks the value of one column based on the value of a dependent column, ensuring that the relationship between them meets the expected criteria.
Dashboard: Visualizing Data Quality Metrics and Insights
The dashboard provides a comprehensive overview of your data quality metrics, offering actionable insights in a visually engaging format. Key components include:
- Data Quality Cards: A quick snapshot of overall data quality, displaying metrics such as Total Test Cases, Test Cases Passed, Test Cases Failed, and Test Cases Aborted. This summary gives users a high-level understanding of the current state of data quality at a glance.
- Test Case Summary Table: This table offers a detailed breakdown of all test cases, including the number of passed, failed, and aborted cases. It provides a clear view of the testing outcomes, helping users to quickly identify areas that need attention.
- Assets by Data Quality Bar Plots: These bar plots visually represent the top 5 assets with the highest data quality and the bottom 5 assets with the lowest data quality. This feature highlights which assets are performing well and which need improvement, enabling targeted action.
Step by step instructions on using the DQ app.
Getting Started with the App
About Page
When you first launch the DQ app, you will be greeted with the About Page. This page provides a high-level overview of the app’s features and capabilities. It is designed to help you understand what the app can do and how it can enhance your data quality management within Snowflake.
Setup Instructions
Following the About Page, the app will guide you through the Setup Process. This includes detailed instructions on the Snowflake privileges that need to be granted for the app to function properly. These privileges include access to the necessary databases, schemas, tables, and warehouses.
- Granting Privileges: Ensure that the app has the required permissions by executing the appropriate GRANT statements in Snowflake. If you need to limit access to certain tables or schemas, you can modify the grant statements to provide more restrictive access as per your organization’s security policies.
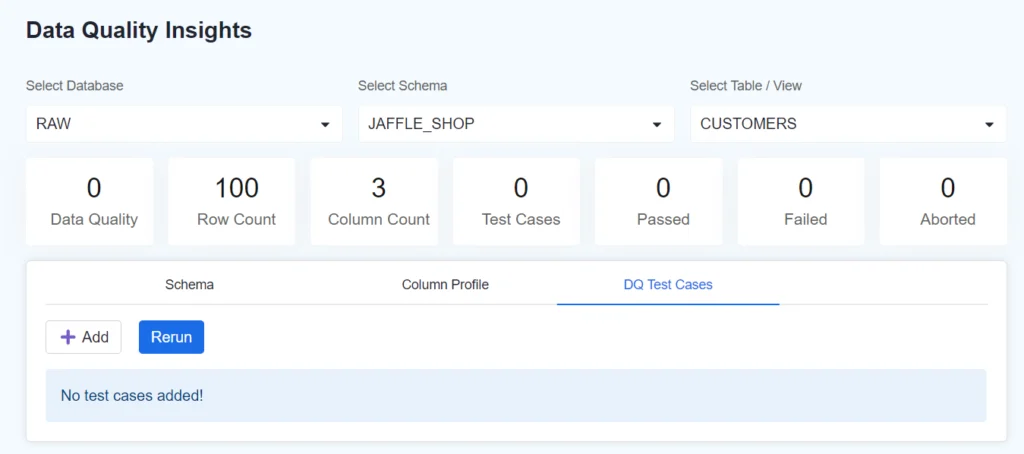
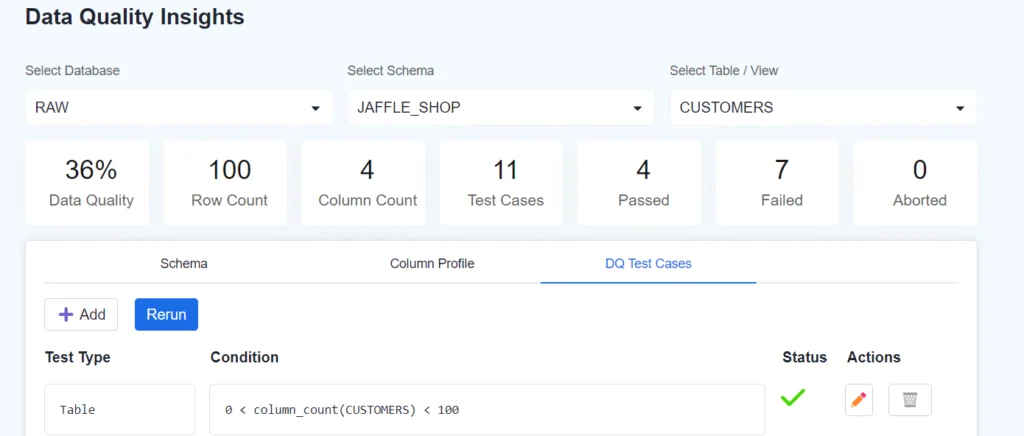
Data Quality Insights
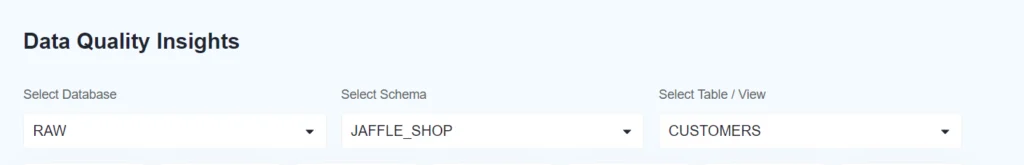
Once setup is complete, navigate to the Data Quality Insights page. This is where you can begin assessing and monitoring the quality of your data.
- Select Database, Schema, and Table/View: Use the interface to choose the database, schema, and specific table or view that you wish to evaluate. The app will then display relevant data quality metrics and insights, allowing you to quickly identify any issues that need attention.
Data Insights for Selected Asset
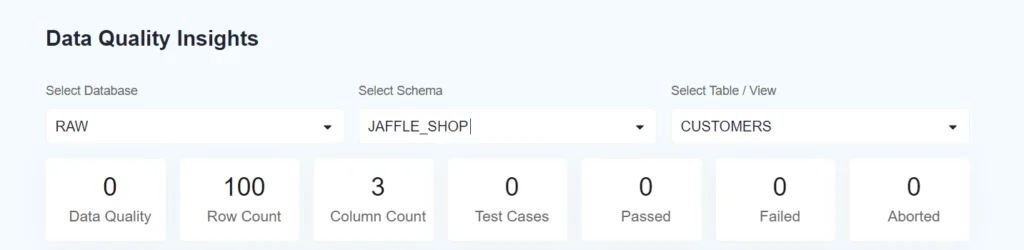
Once an asset (table or view) is selected, the app provides detailed data insights in the form of Data Quality Cards. These cards offer a comprehensive view of the asset’s data quality, including key metrics:
- Data Quality : A summary score that reflects the overall quality of the data based on the executed test cases.
- Row Count: Displays the total number of rows in the selected asset, giving an indication of the dataset’s size.
- Column Count: Shows the total number of columns in the selected asset, providing an overview of the table structure.
- Number of Test Cases: Indicates the total number of test cases associated with the selected asset.
- Test Cases Passed: The number of test cases that have successfully passed, indicating compliance with the defined quality rules.
- Test Cases Failed: The number of test cases that have failed, highlighting potential issues in the data.
- Test Cases Aborted: The number of test cases that were aborted, possibly due to incomplete data or system errors.
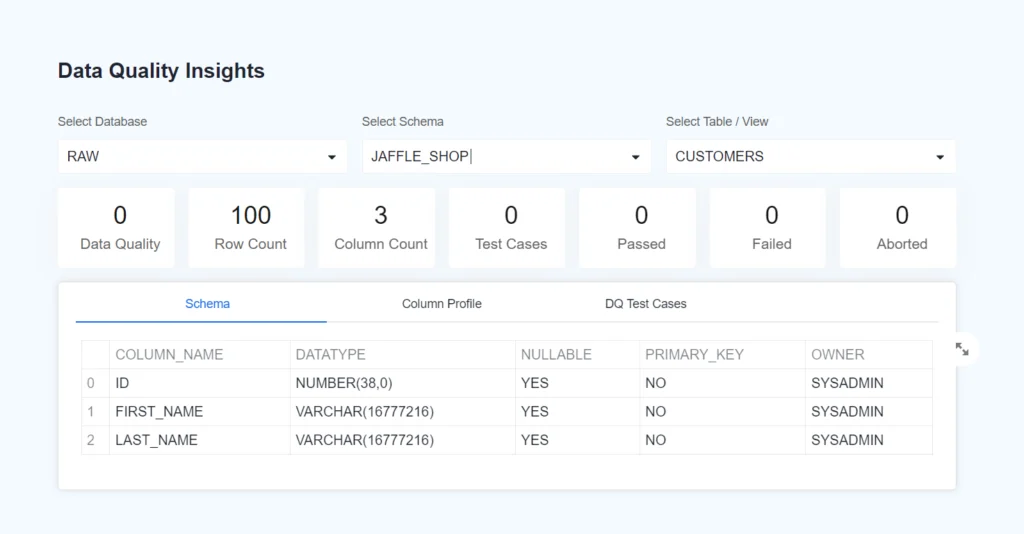
In addition to the Data Quality Cards, the app provides three tabs that offer deeper insights into your selected asset: Table Schema, Column Profile, and Test Cases. These tabs provide detailed information to help you better understand the structure and quality of your data.
1. Table Schema Tab
The Table Schema tab presents detailed information about the selected asset’s schema, including:
- Column Name: The name of each column in the asset.
- Data Type: The data type of each column (e.g., INTEGER, VARCHAR).
- Nullability: Whether the column allows null values.
- Primary Key: Indicates whether the column is part of the primary key.
- Owner: Displays the owner of the asset, giving insight into who is responsible for the data.
This tab provides a comprehensive view of the table’s structure, helping users understand the schema and ensure that it aligns with their data governance requirements.
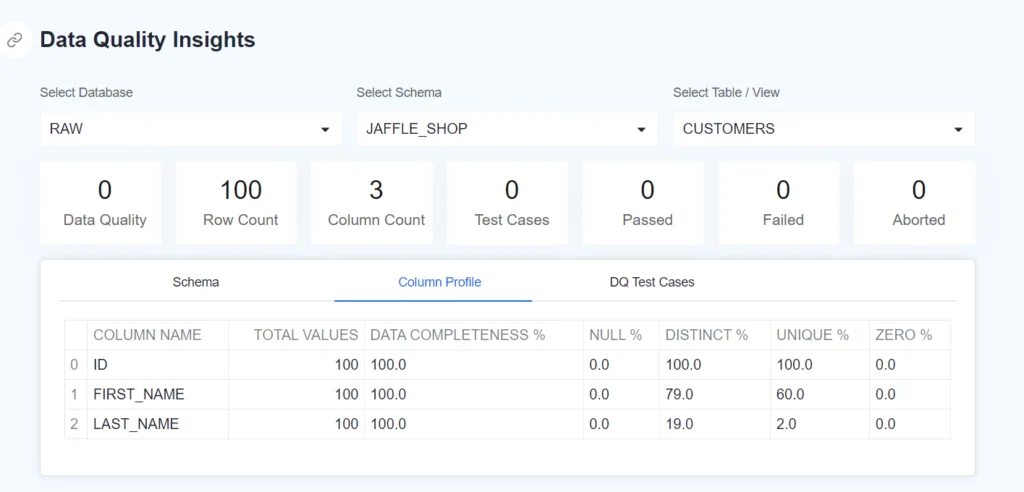
Column Profile Tab
The Column Profile tab provides detailed profiling information for each column of the selected asset. It allows users to assess the quality and characteristics of their data at a granular level. The profiling information includes:
- Column Name: The name of each column in the table.
- Total Number of Rows: The total number of rows that each column contains.
- Data Completeness: The percentage of non-null and non-empty values in each column, indicating how complete the data is.
- Percentage of Null Values: The proportion of null values in each column.
- Percentage of Distinct Values: The percentage of distinct (unique) values in each column.
- Percentage of Unique Values: The percentage of truly unique values, where each value appears only once.
- Percentage of Zero Values: The proportion of zero values in each column, applicable for numeric columns.
This detailed profiling information helps users quickly identify data quality issues such as missing values, duplicates, and incomplete data.
Third tab is DQ Test cases where user can create DQ testcase.
Test Cases Configurations:
** In all the test case configuration Description is an optional field where the user can provide additional information or a description for the test case. It is currently empty in the form.
Creating Test Cases:
Table Test Cases Configuration:
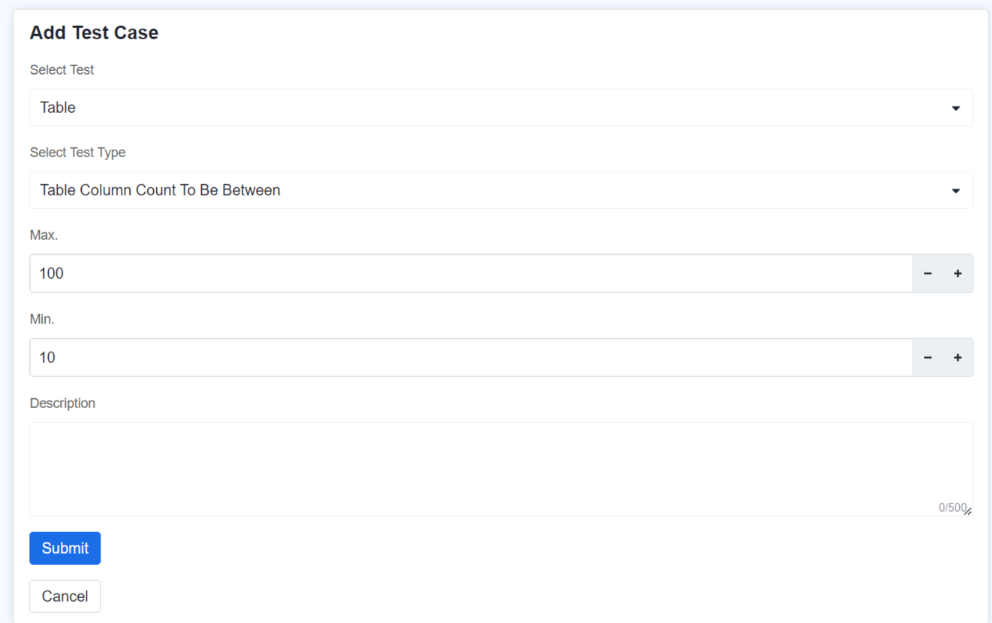
1) Table Column Count To Be Between:
Parameters:
Min.: The minimum value of the range. The test will ensure that the number of columns in the table is not less than this value. Here, the minimum is set to 10.
Max: The maximum value of the range. The test will check that the number of columns in the table does not exceed this value. Here, the maximum is set to 100.
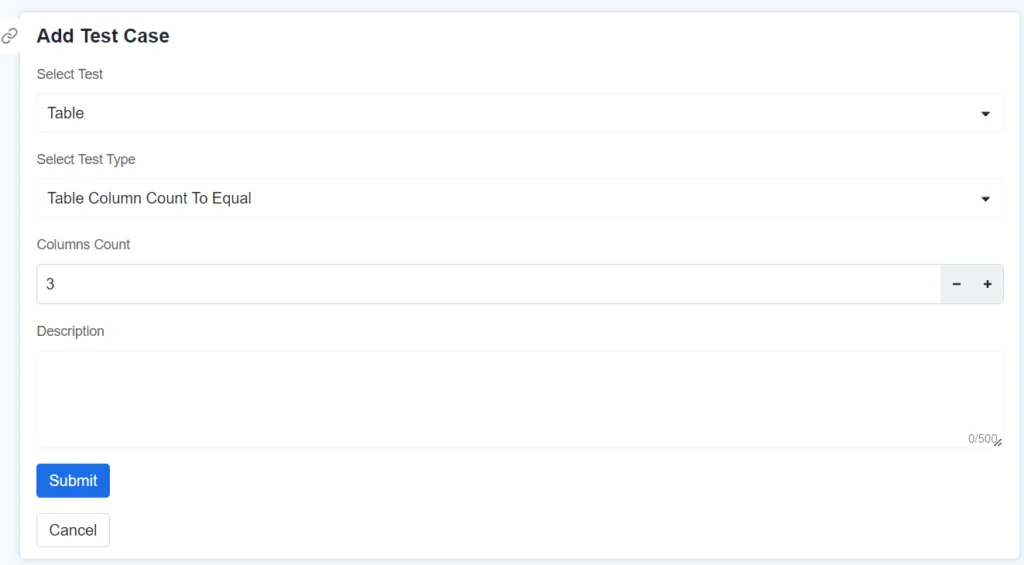
2)Table Column Count To Equal:
Parameters:
Columns Count: The exact number of columns that the table should have for this test case to pass. Here, it is set to 3, meaning the table must have exactly 3 columns.
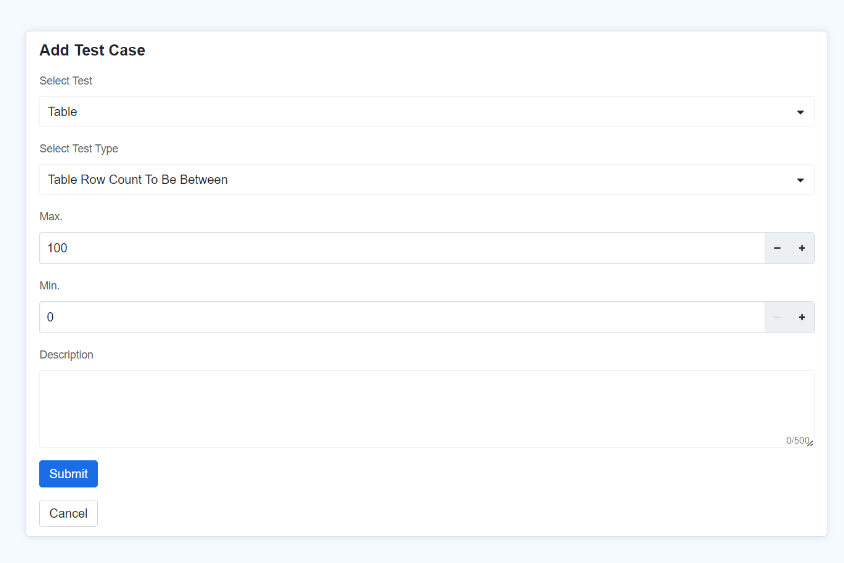
3)Table Row Count To Be Between:
Parameters:
Max.: The maximum value of the range. The test will check that the number of rows in the table does not exceed this value. Here, the maximum is set to 100.
Min: The minimum value of the range. The test will check that the number of rows in the table is not less than this value. Here, the maximum is set to 0.
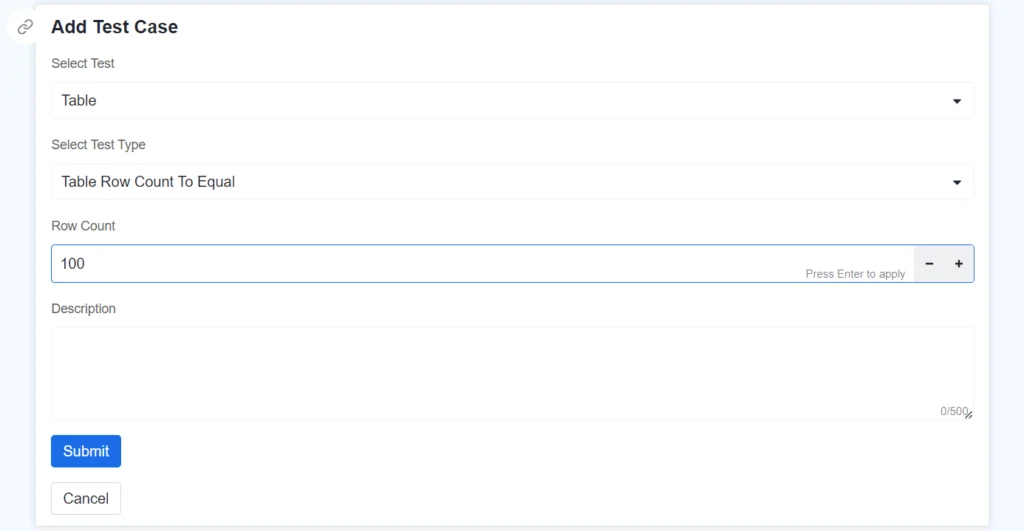
4)Table Row Count To Equal
Parameters:
Row Count: The exact number of rows which a table is expected to have. Here in the image shown, the row count is expected to be to 0.
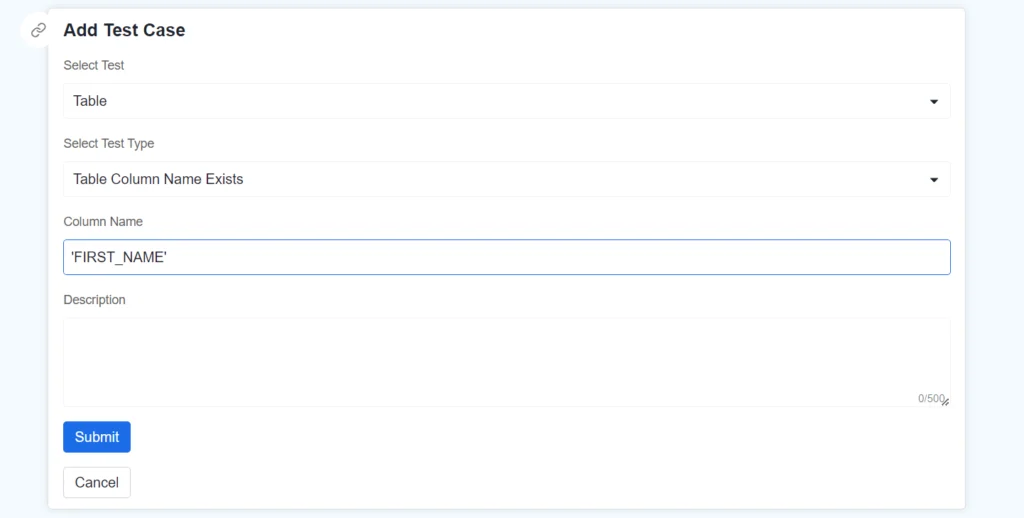
5) Table Column Name Exists
Parameters:
Column Name: The exact name of the column to be specified inside single quotes, whose existence you want to check. Here, the expected column name is ‘FIRST_NAME’.
Column Test Cases Configurations:
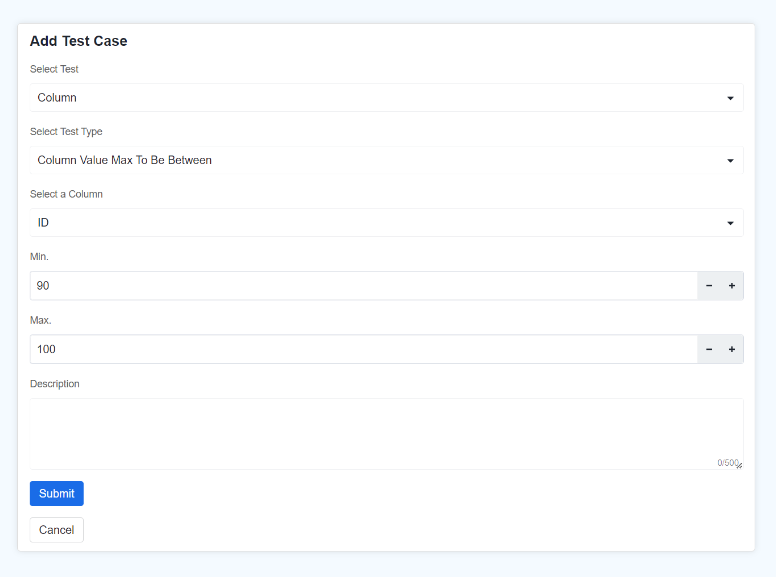
1) Column Value Max To Be Between:
Parameters:
Column: select column name from the provided columns filter.
Min.: The minimum value of the range. The test will check that the maximum value in the selected column is not less than this value.
Max.: The maximum value of the range. The test will check that the maximum value in the selected column does not exceed this value.
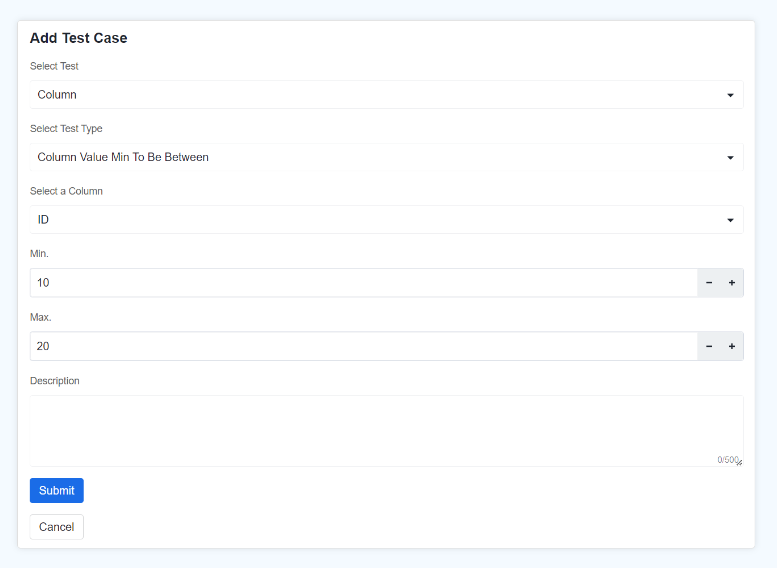
2)Column Value Min To Be Between
Parameters:
Column: Choose the specific column from the table that you want to test.
Max: The maximum value of the range. The test will check that the minimum value in the column does not exceed this value.
Min: The minimum value of the range. The test will check that the minimum value in the column is not less than this value.
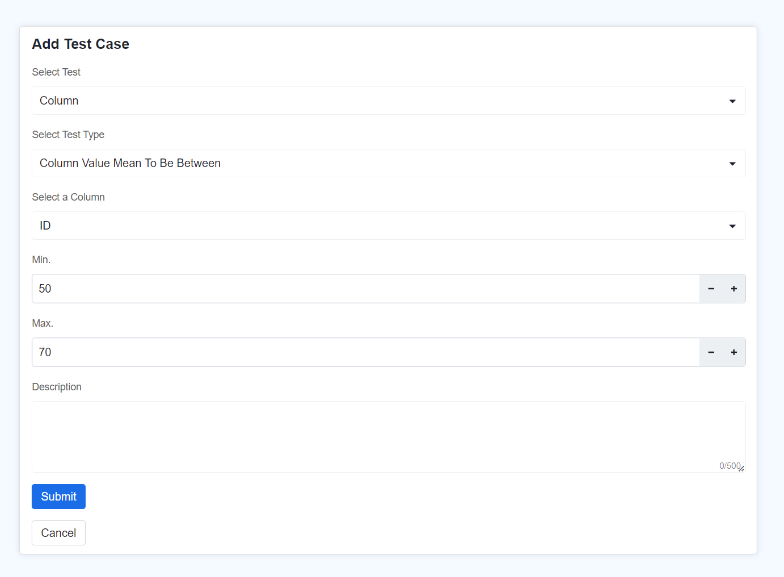
3) Column Value Mean To Be Between
Parameters:
Column: Choose the specific column from the table that you want to test.
Max: The maximum value of the range. The test will check that the average value of the column does not exceed this value.
Min: The minimum value of the range. The test will check that the average value of the column is not less than this value.
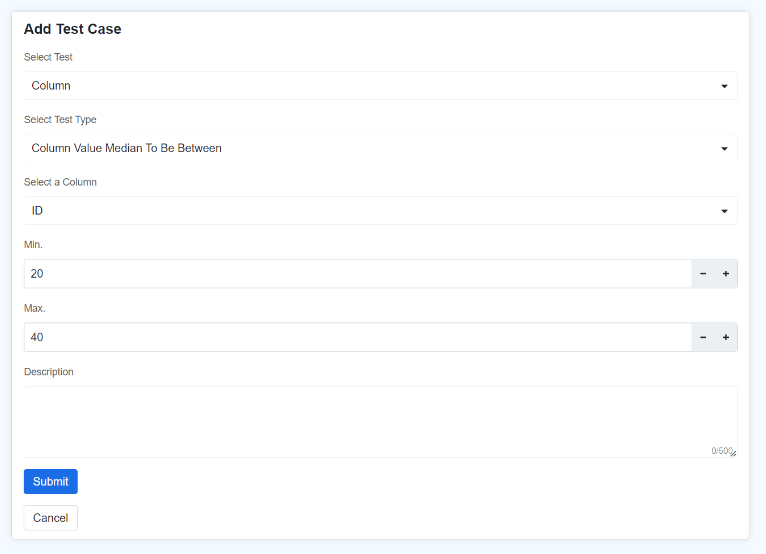
4) Column Value Median To Be Between
Parameters:
Column: Choose the specific column from the table that you want to test.
Max: The maximum value of the range. The test will check that the median of the column does not exceed this value.
Min: The minimum value of the range. The test will check that the median the column is not less than this value.
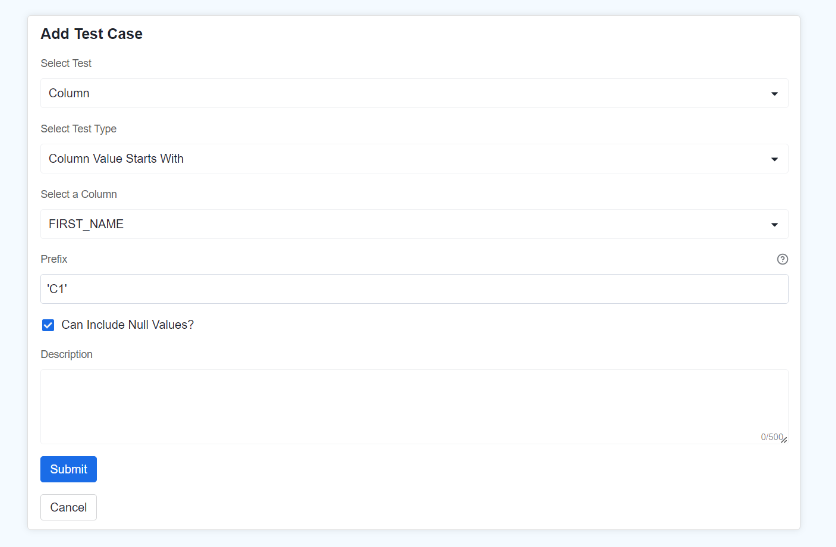
5) Column Value Starts With
Parameters:
Column: Choose the specific column from the table that you want to test.
Prefix: Enter the prefixes within single quotes that the values in the column should start with. If there are multiple prefixes it should be separated by commas.
Can Include Null Values checkbox: Indicate whether the column can start with the prefix and contains null values or not.
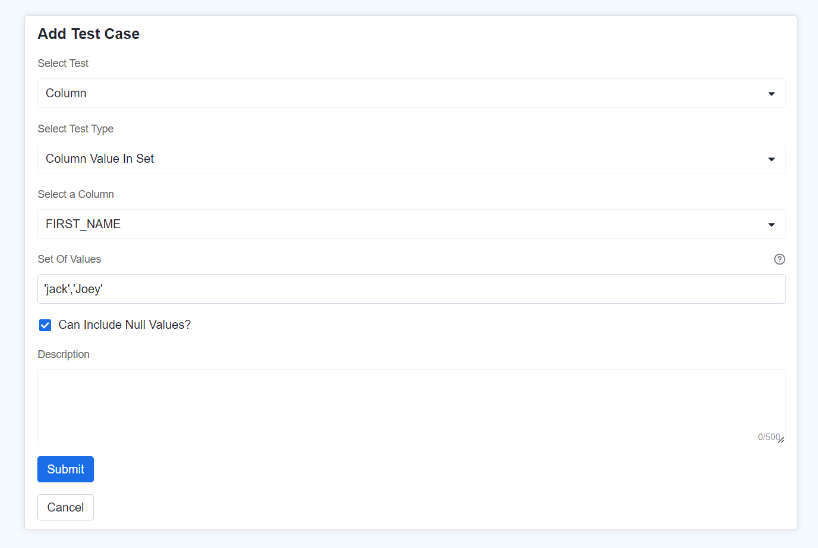
6) Column Value In Set
Parameters:
Column: Choose the specific column from the table that you want to test.
Set Of Values: Enter the set of values that the column values should belong to. Each value should be enclosed inside a single quote if it is not a number, and every value should be delimited by commas.
Can Include Null Values checkbox: Indicate whether the column should belong to set of values and contain null values or not.
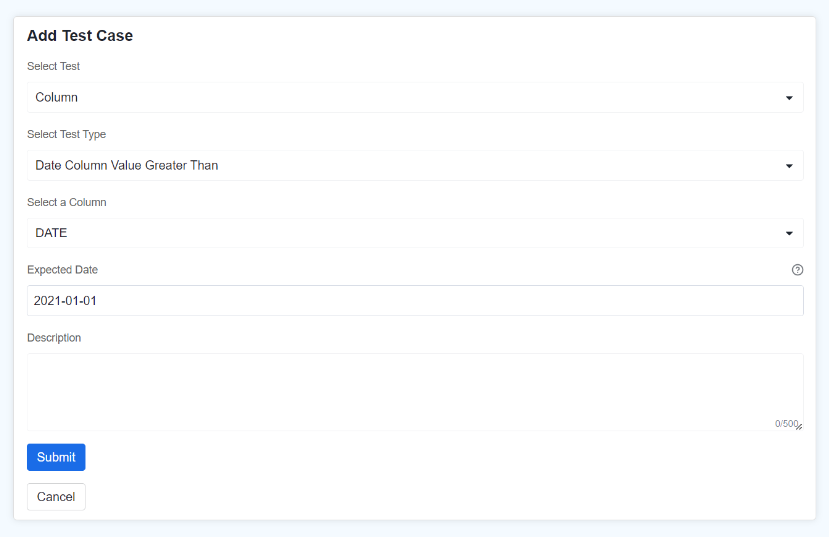
7) Date Column Value Greater Than
Parameters:
Column: Choose the specific column from the table that you want to test.
Expected Date: Enter the expected date value in %Y-%m-%d format (enclosed inside single quote) such that the all the values in the selected column will be greater than the expected date value.
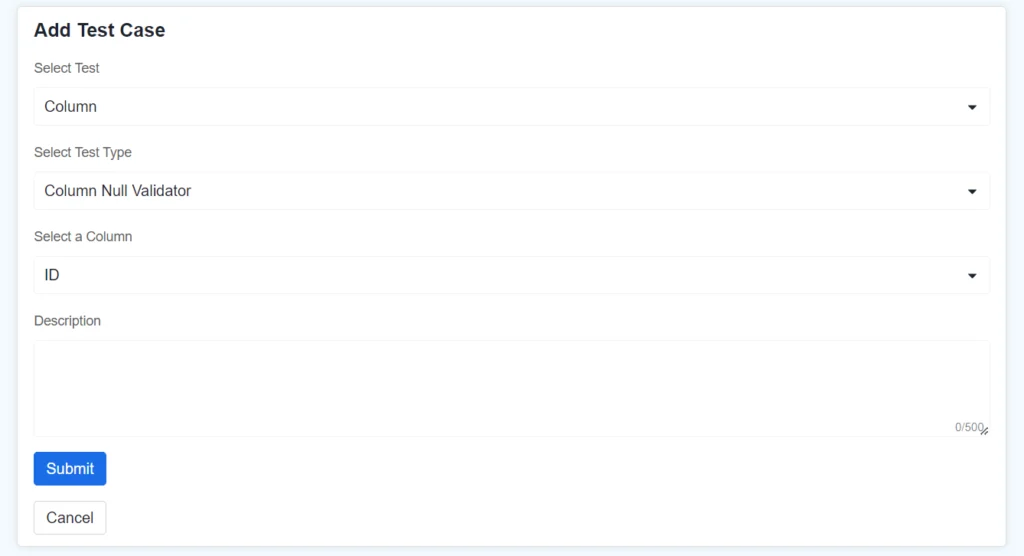
8) Column Null Validator
Parameters:
Column: Select a column from the dropdown to check if all its values are not null.
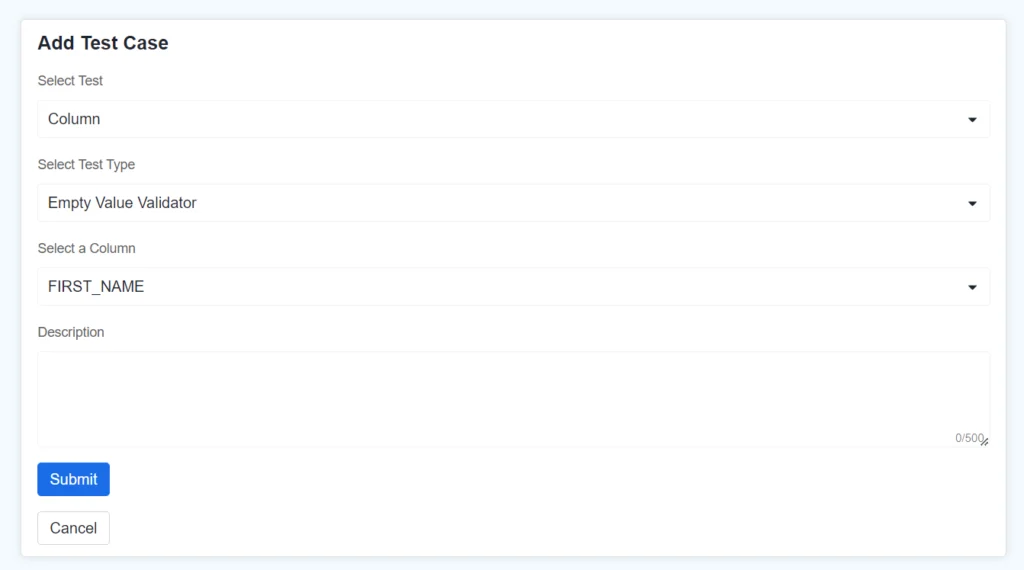
9) Column Empty Validator
Parameters:
Column: Select a column of VARCHAR or CHAR type from the dropdown to check if all its values do not contain empty strings.
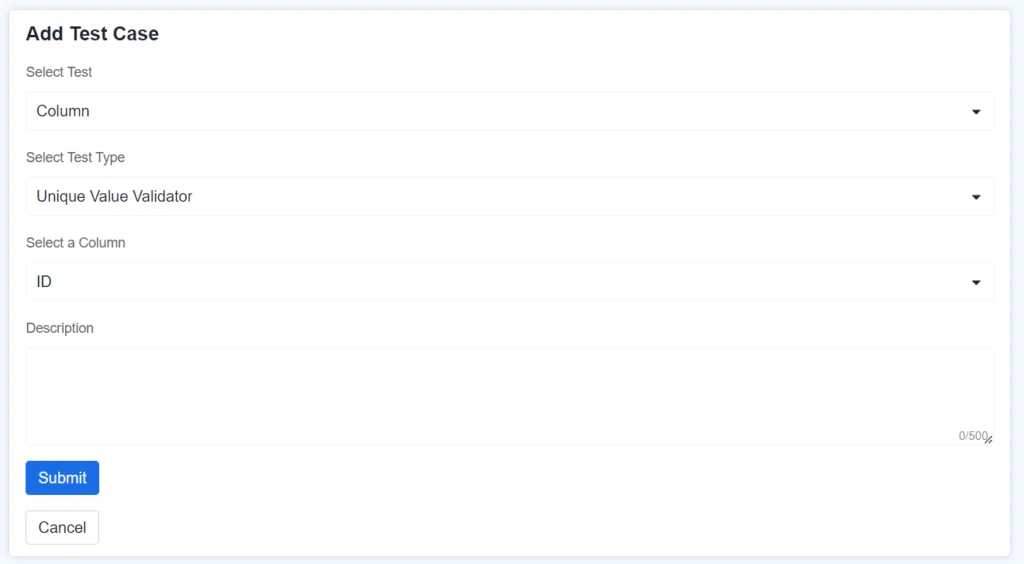
10) Unique Value Validator
Parameters:
Column: Select a column from the dropdown to check if all its values are unique.
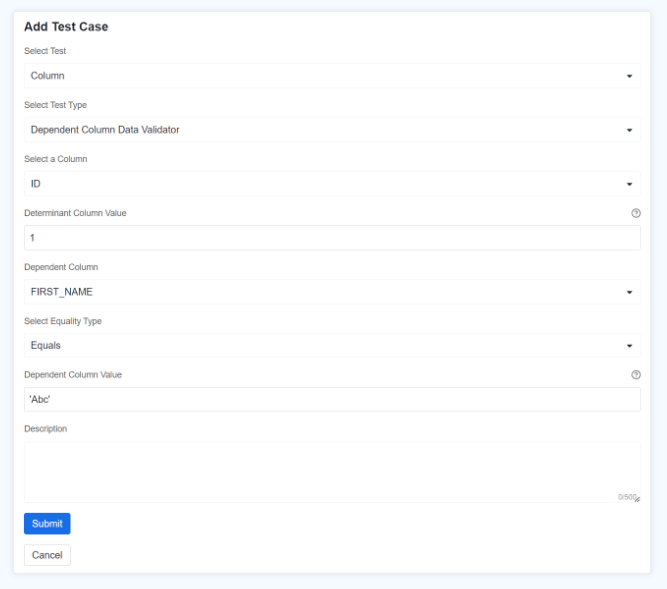
11) Dependent Column Data Validator
Parameters:
Column: Select the determinant column, meaning the value in this column will determine the validation condition.
Determinant Column Value: This is the value in the determinant column that triggers the validation of the dependent column. If it is a string enter inside single quote.
Dependent Column: Select dependent column, whose values will be validated based on the value in the determinant column.
Equality Type: This specifies the type of comparison to be made between the dependent column’s value and the expected value. It can be ‘equals to’ or ‘not equals to’.
Dependent Column Value: This is the value in the dependent column, which is expected based on the expected value of determinant column.
Editing, Deleting, Rerunning test Cases.
Users can edit the expected values for all test case types except for the Column Null Validator, Column Empty Validator, and Column Unique Validator, as these test cases do not require user-provided expected values—only the column name is needed.
Users can also delete the Testcases which are no longer needed through UI.
Test Cases can also be reran manually using ‘rerun button’ when table data is modified or new data is added to the table.
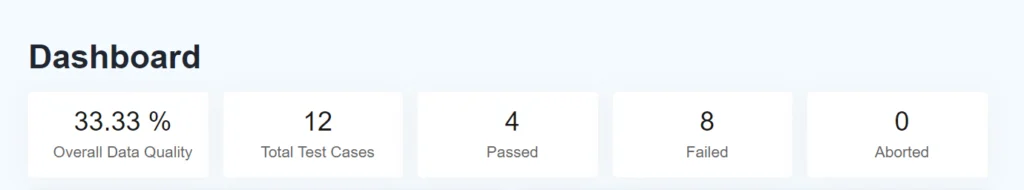
Dashboard
Dashboard Metrics: This section provides an overview of key metrics related to data quality:
- Overall Data Quality: Displays the percentage of data quality across all assets.
- Total Test Cases: Shows the total number of test cases that have been created.
- Passed: Indicates the number of test cases that have successfully passed.
- Failed: Indicates the number of test cases that have failed.
- Aborted: Displays the number of test cases that were aborted or did not complete.
These metrics give you a quick snapshot of the current state of data quality and the outcomes of the test cases created for your assets.
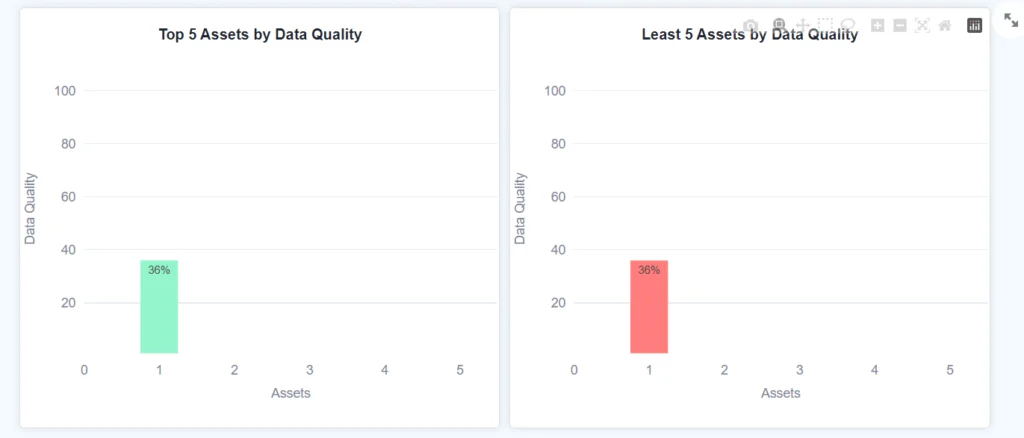
DQ Bar Charts: There are two barcharts in the dashboards section which are as follows:-
- Top 5 Assets by Data Quality: Bar chart showing the top 5 assets (tables, views) with the highest data quality.
- Least 5 Assets by Data Quality: Bar chart showing the 5 assets with the lowest data quality.
Test Cases By Results Pie chart: This Pie chart shows the percentage of passed, failed and aborted testcases for a particular table. Users can select the asset from the filters provided in the left bottom panel of the web app.

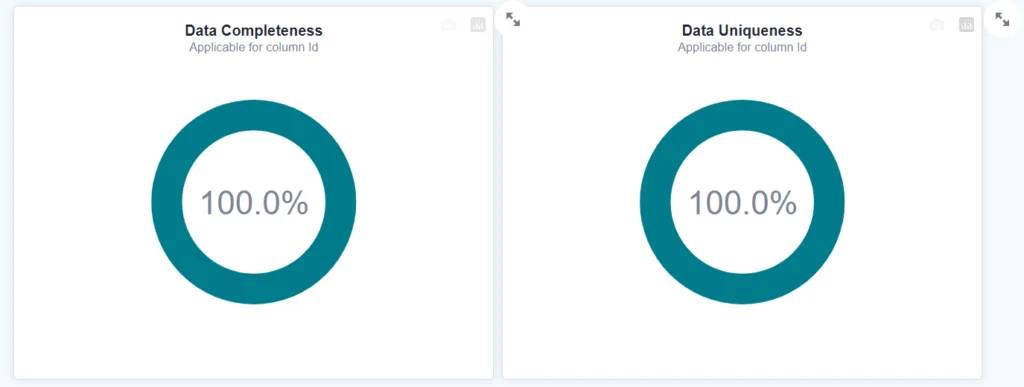
Data Completeness and Uniqueness Donut charts: These charts show the percentage of complete data and unique data for a particular column respectively. Users can select the asset and column from the filters provided in the left bottom panel of the web app.
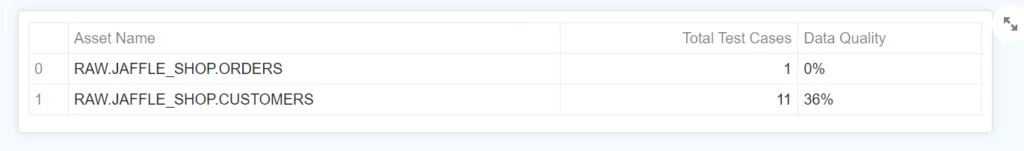
Test Case Table: This table displays all the assets and their data quality respectively.
Limitations
The current app doesn’t support scheduling DQ job, so user need to manually rerun the testcases every time the data is updated.
Currently DQ app works fine with around 10M data, and it doesn’t support adding custom testcases.
About Authors
Omkar Prabhu – Omkar serves as the Center Head, managing the Goa location at Zimetrics. He brings extensive industry experience in building scalable applications and data solutions. Beyond his primary role, Omkar contributes as a Data Architect, where he excels in implementing multiple data lake solutions using the Snowflake ecosystem, showcasing his expertise in modern data architectures.
Satagonda Jatrate – Satagonda, a Software Engineer at Zimetrics, specializes in Snowflake, focusing on ETL pipelines, data sharing, and transformation. His proficiency drives efficient workflows and delivers actionable insights, empowering data-driven decision-making.
