The client had built rich digital marketing operations on capable individual platforms and had standardized a modern data stack underneath them. What was missing was the connective layer between the two. Marketing analytics maturity lagged the platform investment.
Reporting was fragmented along two axes, by platform and by OpCo. GA4, Google Search Console, Sprout Social, HubSpot, and the three paid media systems (Meta Ads, Google Ads, LinkedIn Ads) each generated detailed performance data, but the data stayed in each platform’s reporting layer rather than flowing into the Lakehouse as governed marketing datasets. Metric definitions and attribution rules varied between BUs, making cross-OpCo benchmarking inconsistent. Manual reconciliation between platforms slowed insight generation, and onboarding a new region or brand required bespoke integration work each time. As digital marketing investment grew, the gap between platform-level data and enterprise-level decision-making widened.
The DMIC could not give leadership a single, governed view of marketing performance across the enterprise. Without standardized KPIs, attribution logic, and a reconciled data layer, marketing ROI conversations defaulted to platform-specific narratives rather than a consolidated view of where investment was working hardest. Continuing on this path meant compounding technical debt with every new campaign, channel, or acquisition, while leaving cross-OpCo benchmarking out of reach. The organization concluded that another dashboard initiative would not solve the problem. What was needed was a centralized marketing data foundation built for scale.

Zimetrics framed the engagement through an architectural lens. The objective was to engineer a governed marketing data foundation on which any number of current and future dashboards could be built without rework. The architectural principle was a medallion-layered data warehouse fed by a reusable, source-agnostic ingestion framework, with consumption isolated behind certified semantic models in Power BI.
This framing changed three things:
1. It shifted scope from per-OpCo, per-platform reporting to enterprise-wide standardized KPIs.
2. It moved ingestion logic out of point-to-point scripts and into a reusable Databricks LakeFlow framework.
3. It placed governance, RBAC, and CI/CD into the architecture from day one rather than as a followup phase.
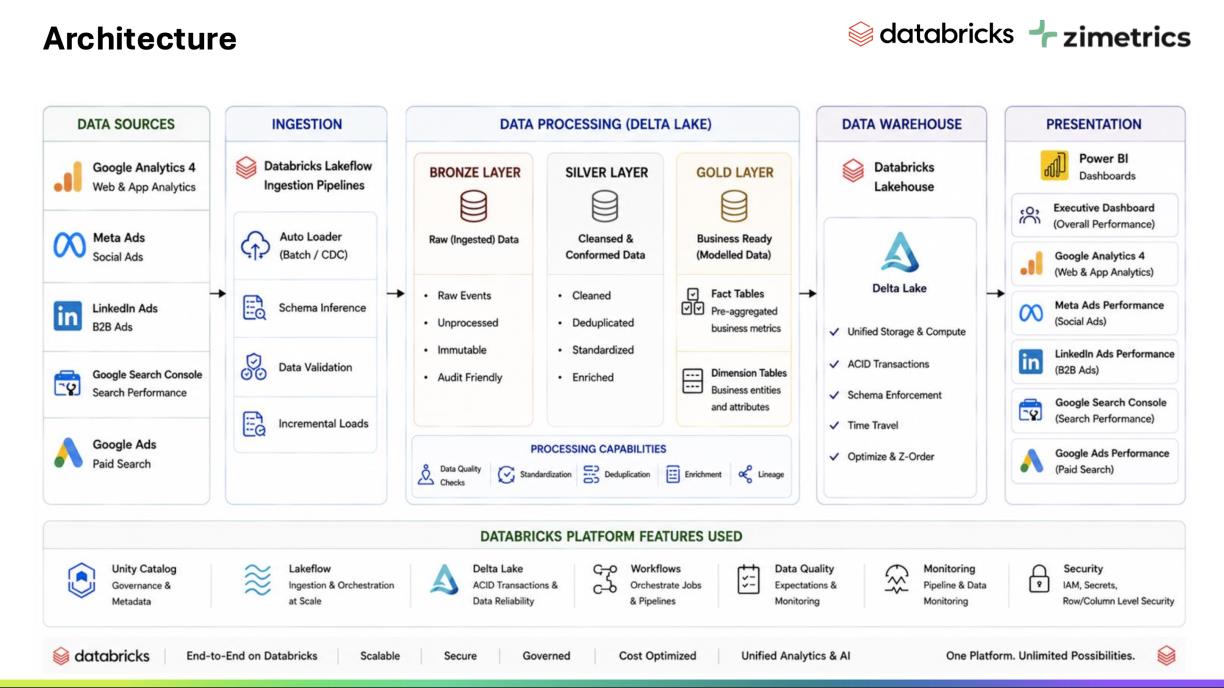
Databricks LakeFlow was selected for ingestion because the source landscape required incremental, watermarked pulls from marketing APIs with different cadences, schemas, and rate limits. A PySparkbased standardized ingestion framework on LakeFlow lets the team onboard GA4, Google Search Console, Sprout Social, and the paid media APIs through shared patterns rather than per-source pipelines. Checkpointing and restartability meant failed runs could be safely re-run without data loss or duplication.
Delta Lake on the Databricks Lakehouse provided the unified storage layer for the medallion pattern. Bronze preserved raw audit-ready data, Silver applied cleansing and standardization, and Gold published analytics-ready KPI and attribution models. Each layer carried a single, clear responsibility, simplifying governance and accelerating downstream BI development.
Power BI was the client’s enterprise standard for analytics consumption. The architectural decision was where KPI logic should live: a certified semantic model sits between Gold tables and the dashboards, so KPIs are defined once at the model layer and inherited by every dashboard rather than re-implemented in DAX across each report.
The ingestion layer was built as a single PySpark framework on Databricks LakeFlow, parameterized by source. GA4, Google Search Console, Sprout Social, and the paid media APIs shared the same orchestration, error-handling, and observability patterns, while source-specific connector logic sat behind a common interface. Onboarding a new OpCo or a new source did not require a new pipeline, only a new configuration.
Incremental ingestion was implemented with source-appropriate watermarking. GA4 used eventtimestamp watermarking with a rolling lookback to handle late-arriving events. Google Search Console used a date-based ingestion with an optional rolling re-pull window. Sprout Social used a date-overwrite strategy to handle metric restatements. Failed runs did not advance checkpoints, so re-runs were safe and lossless. Record-count and hash-based validation across consecutive loads caught silent drift before it reached downstream consumers.
Data landed directly in Delta Lake through Lakeflow, with row-count and schema validation gates running before each load.
The consumption layer was a Power BI environment connected to the Delta Lake Gold layer through a certified semantic model. Facts, dimensions, KPIs, and DAX were defined once at the model layer and inherited by every dashboard, so the same metric never carried two definitions across reports. Dashboards loaded against the model within the agreed five-second SLA.
The dashboard portfolio was organized in three tiers. Executive Summary provided the enterprise-wide overview. Six channel dashboards covered Website Performance, Ecommerce Performance, Email Performance, Organic Social, Campaigns Performance (Paid), and Organic Search, the last of which combined traditional SEO metrics with AI-driven discovery signals. Audience Insight sat across channels, giving DMIC and OpCo teams a unified view of how audiences engaged regardless of where they came from.
Access was governed by three personas with row-level security at the semantic layer. DMIC Executives saw the consolidated enterprise view. OpCo Executives and OpCo Leads saw only their own OpCo’s data. The same model served all three; the data each user saw was filtered by their role.
Access control was consistent end-to-end. Role-based access control was implemented in Databricks and Power BI against the same Azure Active Directory identities and the same enterprise security policies. An OpCo Lead saw the same scoped data whether they were running a Databricks SQL query, opening a notebook, or reading a Power BI dashboard.
Monitoring ran end-to-end. Pipeline health was tracked across Lakeflow ingestion and Databricks Workflows jobs. Data-quality checks flagged volume anomalies and schema drift before they propagated to downstream layers. Alerting fired on ingestion failures and SLA breaches, routed to the on-call channel rather than buried in logs.
CI/CD covered the full stack. Databricks notebooks and Power BI dashboards each promoted through Dev, QA, and Prod through their own pipeline.